
This page allows modelling chemical membrane degradation in low temperature proton exchange membrane fuel cells based on the following set of chemical equations:
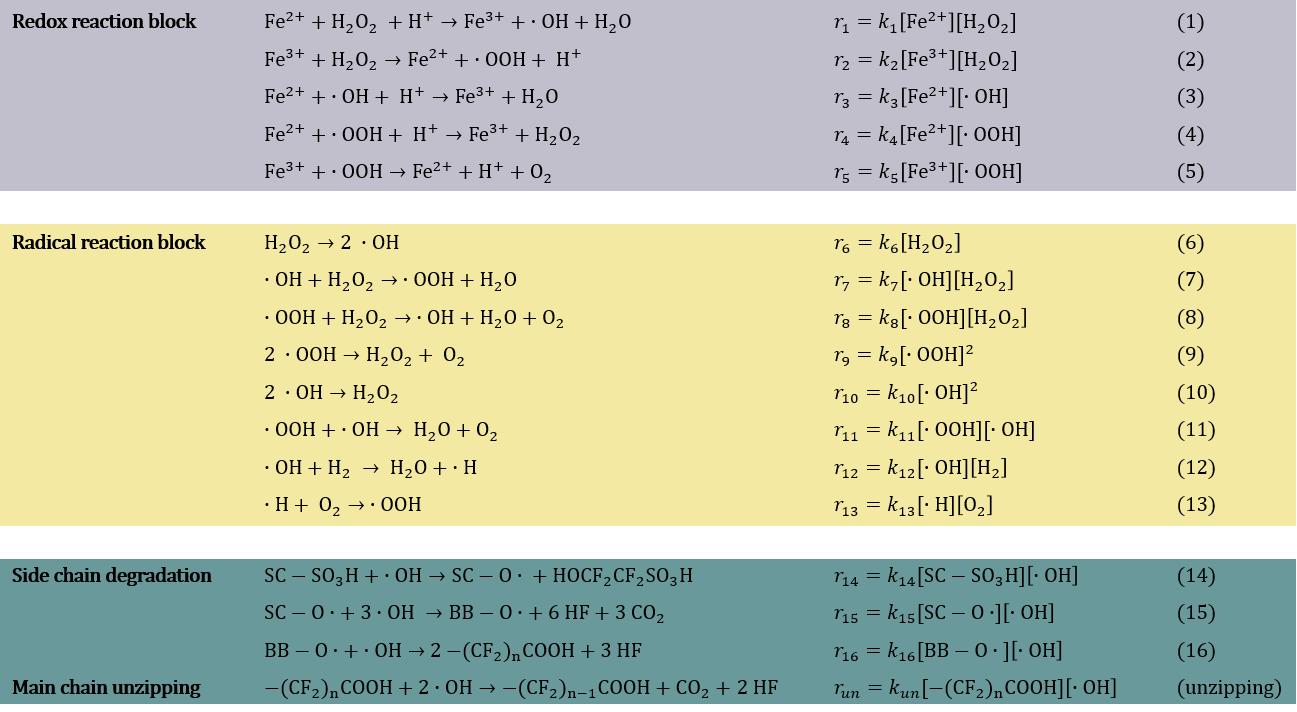
The set of reactions starts with the Fenton reaction (Equation (1)) in which a ferrous ion reacts with hydrogen peroxide to form a hydroxyl radical. Equations (2) – (13) describe the formation of additional radical species, the reactions of the radical species with other constituents of the system or with each other. The last 4 equations ((14) – (16) and (unzipping)) express the reactions of hydroxyl radicals with the ionomer membrane.
Temperature-dependence of the rate constants is expressed via the Arrhenius law

with kn = rate constant for the n-th reaction [L mol-1 s-1] or [s-1], An = pre-exponential factor for the n-th reaction [L mol-1 s-1] or [s-1], Ea,n = activation energy for the n-th reaction [J mol-1], R = gas constant (8.314 J K-1 mol-1) and T = temperature [K].
The concentrations of iron contaminants (Fe2+ and Fe3+) as well as the concentration of H2O2, H2 and O2 can be chosen freely. Furthermore, the concentration of the head groups (SC-SO3H) can be set to a desired value. Kinetic data (activation energies, pre-exponential factor) are set to fixed values.
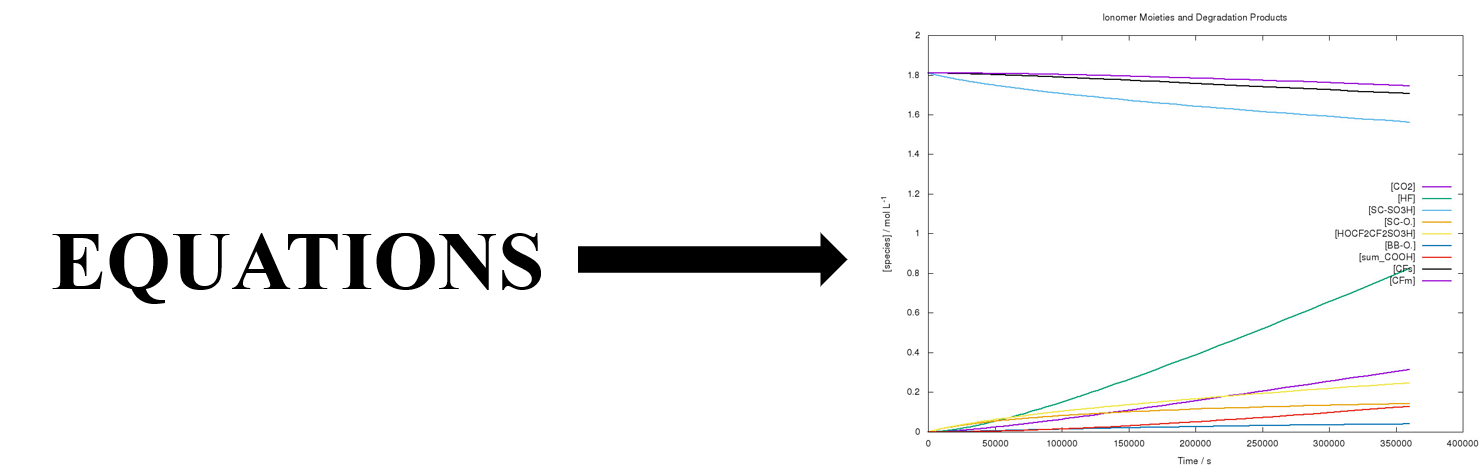
Graphs showing the concentrations of the individual species versus time are received as output. In addition, the input file for COPASI and the result files (concentrations and fluoride emission rates) can be downloaded.

For a full explanation please see:
P. Frühwirt, A. Kregar, J. T. Törring, T. Katrašnik, G. Gescheidt, Phys. Chem. Chem. Phys. 2020, 22, 5647-5666
The calculations are performed using the program COPASI (version 4.23.184), available under the Artistic License 2.0. We are grateful to the authors of COPASI for allowing us to integrate it into this website.
Financial support by the Austrian Research Promotion Agency (FFG; project number: 854867) and by the Slovenian Research Agency (research core funding no. P2-0401) is gratefully acknowledged. This page was developed in connection with the SoH4PEM (State of Health Monitoring for Proton Exchange Membrane Fuel Cell Stacks) project. For further information see: institute.tuwien.ac.at/soh4pem.